Four clients, one spec, one frozen suite, one measurement pass. Every number below comes from a file in the public evidence, five runs per metric, medians with the range, on one PC in November 2026. The short version: React and Angular are within a few percent of a no-framework baseline on every startup and interaction number; Blazor WebAssembly ships 28 times React's bytes and pays for it on a slow link and on a phone; Blazor Server loads like a static site and then charges a round trip for every click. The AI built all four without a hand fix. The seven hypotheses written before the first build are settled one by one at the end, and three of them were wrong.
- Read Part 1 first if you have not: it says what was built, by whom, and under which rules
- Read each table with its baseline row: the reference client is the same app with no framework at all
- Where a Blazor Server 100 ms row looks mild, read the WebSocket note under the interactions table before trusting it
- Check the seven hypotheses against your own expectations before you read the verdicts
- Clone the repository; every raw JSON file the tables quote is listed in its results page
- Rerun one metric yourself with the commands at the end and compare the medians
A. Size: on disk and on the wire
| Client | Files | Bytes on disk | Brotli bytes | Cold requests | Cold bytes | Warm reload bytes |
|---|---|---|---|---|---|---|
| Reference (no framework) | 5 | 53,413 | 12,750 | 7 | 19,261 | 4,597 |
| React 19 | 5 | 308,489 | 81,234 | 7 | 87,780 | 4,619 |
| Angular 22 | 6 | 335,960 | 86,047 | 9 | 108,078 | 5,597 |
| Blazor WebAssembly | 100 | 18,416,925 | 4,079,883 | 53 | 2,461,774 | 5,114 |
| Blazor WebAssembly, AOT | 100 | 30,933,293 | 6,335,002 | 53 | 4,716,896 | 5,119 |
| Blazor Server | 70 (whole publish folder) | 9,889,281 | 1,259,494 (SDK, 60 files) | 20 | 78,181 | 15,539 |
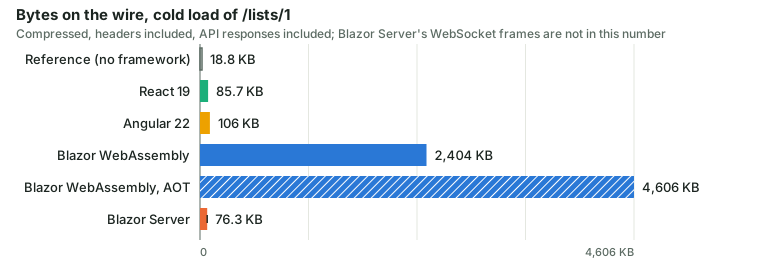
A cold load of the first list costs React 88 KB and Angular 108 KB. Blazor WebAssembly costs 2.46 MB in 53 requests, and the AOT build 4.72 MB: the runtime, the framework assemblies and the app, Brotli-compressed by the same tool at the same level as every other client. Blazor Server's 78 KB is the prerendered page and the framework script; the rows arrive over the WebSocket, about 124 KB of frames per load, which the request counter does not see. Warm reloads are small everywhere because every client's files answer 304, except Blazor Server, which renders the page again on the server.
B. Startup
| Client | First row, unthrottled | First row at 100 ms RTT | Desktop score | Desktop LCP | Mobile score | Mobile LCP | Mobile TBT |
|---|---|---|---|---|---|---|---|
| Reference | 211.4 ms (119.3, 215.4) | 564.7 ms (533, 595.8) | 100 | 331.97 ms | 99 | 929.8 ms | 0 |
| React 19 | 208 ms (126.3, 232.2) | 553.6 ms (490.6, 675.6) | 100 | 408.79 ms | 99 | 1,659.78 ms | 0 |
| Angular 22 | 205.9 ms (205.6, 218.8) | 549.2 ms (529.3, 586.3) | 100 | 465.62 ms | 100 | 1,888.36 ms | 16 ms |
| Blazor WebAssembly | 666.1 ms (642.2, 692.2) | 3,031 ms (2,967.9, 3,055.7) | 72 (70, 76) | 2,947.58 ms | 34 (34, 36) | 16,211.8 ms | 1,526 ms |
| Blazor WebAssembly, AOT | 683.4 ms (619.6, 764.3) | 5,050.9 ms (4,987.2, 5,089.3) | 68 (65, 68) | 4,550.22 ms | 32 | 26,703.57 ms | 1,335 ms |
| Blazor Server | 209.5 ms (129.3, 216.1) | 1,160.6 ms (1,109, 1,302.3) | 100 (94, 100) | 485.93 ms | 99 (97, 99) | 1,955.21 ms | 3 ms |
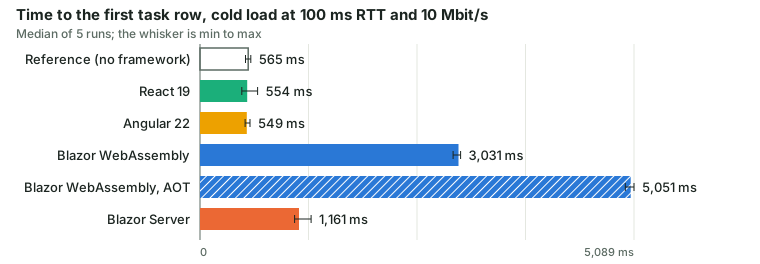
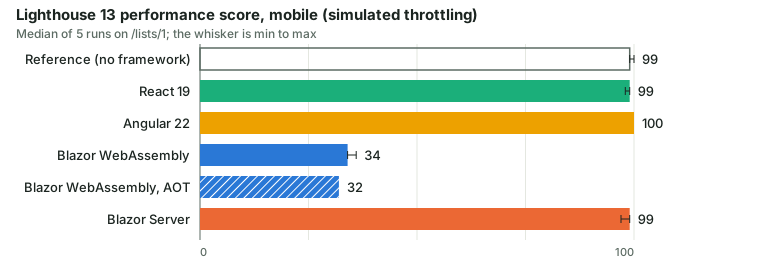
Unthrottled on a fast PC, the three JavaScript clients and Blazor Server all show the first row in about 210 ms; Blazor WebAssembly needs 666 ms to download and start the runtime. At 100 ms round trip the gap opens: half a second for the small clients, 1.2 s for Blazor Server (the circuit handshake comes after the page), 3.0 s for WebAssembly and 5.1 s for its AOT build, which is bigger, not faster, at startup. Lighthouse's mobile preset, which simulates a slow phone on a slow link, puts WebAssembly at 34 with 1.5 s of total blocking time and a 16-second largest paint; desktop gives it 72. Every other client scores 99 or 100 in both presets.
C. Interactions on the 10,000-row list
| Client | Select list | Per key | Toggle | Panel open | Sort title | Select all | Scroll fps |
|---|---|---|---|---|---|---|---|
| Reference | 109.6 | 12.1 | 16.2 | 15.6 | 26.7 | 13.7 | 59.97 |
| React 19 | 126.5 | 17.1 | 16.7 | 33.4 | 29 | 18.6 | 56.52 |
| Angular 22 | 150.1 | 22.3 | 17.9 | 32.2 | 27.5 | 33.2 | 56.41 |
| Blazor WebAssembly | 1,302.7 | 83.4 | 36.2 | 68 | 84.5 | 48.2 | 56.33 |
| Blazor WebAssembly, AOT | 1,530.7 | 31.9 | 16.8 | 27.4 | 24 | 22.1 | 56.29 |
| Blazor Server | 131.7 | 36 | 38.3 | 41 | 30.8 | 33.1 | 56.15 |
| Client | Select list | Per key | Toggle | Panel open | Sort title | Clear search |
|---|---|---|---|---|---|---|
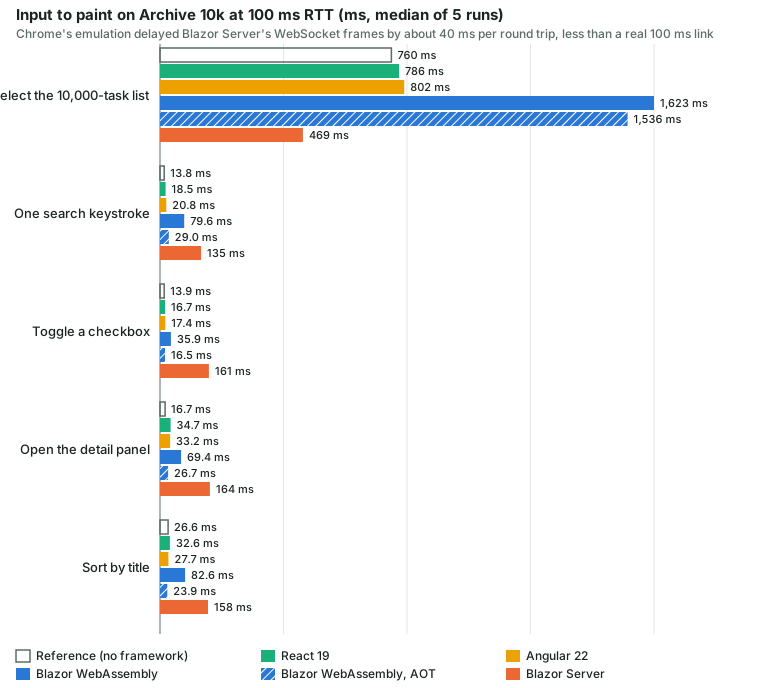
| Reference | 760.2 | 13.8 | 13.9 | 16.7 | 26.6 | 16.6 |
| React 19 | 785.6 | 18.5 | 16.7 | 34.7 | 32.6 | 20.3 |
| Angular 22 | 802.5 | 20.8 | 17.4 | 33.2 | 27.7 | 34.5 |
| Blazor WebAssembly | 1,623.1 | 79.6 | 35.9 | 69.4 | 82.6 | 69.8 |
| Blazor WebAssembly, AOT | 1,536.3 | 29 | 16.5 | 26.7 | 23.9 | 23.1 |
| Blazor Server | 469.4 | 135 | 160.7 | 164 | 157.6 | 392.3 |
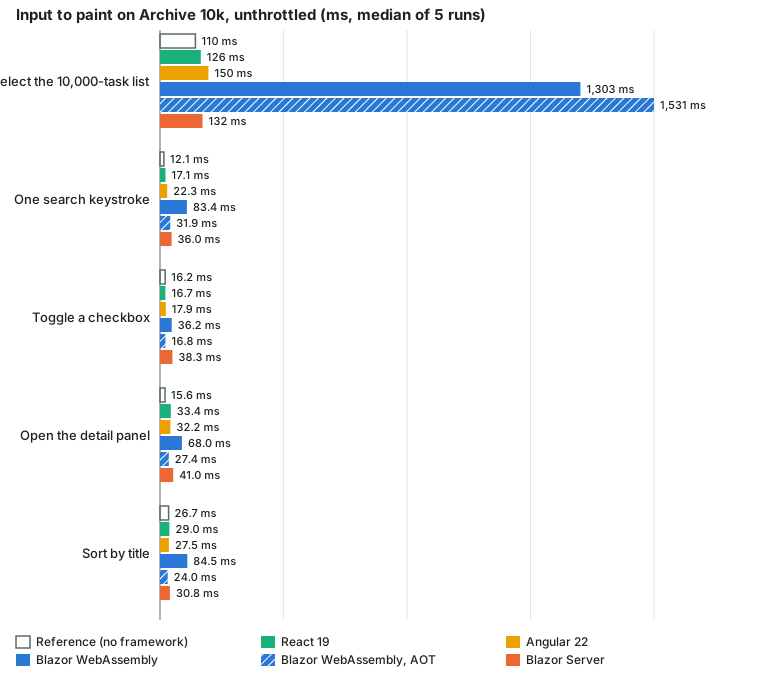
Unthrottled, React and Angular sit within a few milliseconds of the baseline on every interaction. Blazor WebAssembly without AOT is the slow one: 83 ms per search keystroke against 17 for React, 1.3 s to select and render the list against 127 ms, a visible pause on every sort. AOT compilation fixes the interactions almost entirely (32 ms per key, 17 ms toggle, 27 ms panel) at the price of the 4.7 MB download above, and still takes 1.5 s to select the list. Blazor Server is React-like unthrottled, because the server is on the same machine.
At 100 ms round trip the picture flips for Blazor Server: a checkbox toggle takes 161 ms, a keystroke 135 ms, clearing the search 392 ms, because every one of them is a trip to the server and back. Selecting the list is faster than anyone else's 760 ms, since the browser never downloads the 10,000 rows. One caveat, measured rather than assumed: Chrome's network emulation delayed the WebSocket frames by about 40 ms per round trip, not the 100 ms it added to HTTP (a direct check: an HTTP fetch went from 7.05 ms to 248.25 ms, a Blazor click-to-render round trip from 7.15 ms to 46.95 ms). So Blazor Server's 100 ms rows are a floor; on a real 100 ms link every one of them is worse.
D. Memory
| Client | JS heap used | DOM nodes | WebAssembly linear memory |
|---|---|---|---|
| Reference | 4,860,824 | 1,321 | none |
| React 19 | 5,987,620 | 1,207 | none |
| Angular 22 | 7,263,424 | 2,716 | none |
| Blazor WebAssembly | 4,684,860 | 1,900 | 58,064,896 |
| Blazor WebAssembly, AOT | 8,463,392 | 1,900 | 58,064,896 |
| Blazor Server | 2,883,124 | 6,327 | none |
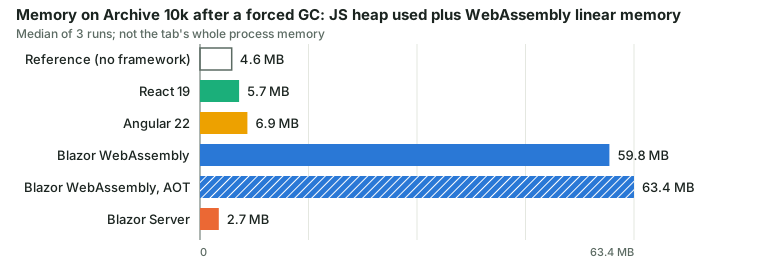
Blazor WebAssembly's JavaScript heap is the smallest of the four because the data lives in a 58 MB WebAssembly heap instead. Blazor Server keeps the least in the browser and the most in the DOM: 6,327 nodes, because its Virtualize overscan of 50 rows renders 117 rows at a time. On the server, the published process grew from 91 MB working set with no browser to 122 MB with one circuit on Archive 10k and 229 MB with ten, about 11 MB per open tab.
E. Developer metrics
| Client | Cold build | Dev start | App lines | Source files | Deps direct / total | Install size | Suite run |
|---|---|---|---|---|---|---|---|
| Reference | 829 ms (786, 1,408) | 1,060 ms | 1,133 | 5 | 2 / 73 | 68.0 MB | 44 s |
| React 19 | 1,017 ms (978, 4,322) | 1,052 ms | 1,378 | 6 | 10 / 59 | 104.4 MB | 67.8 s |
| Angular 22 | 3,347 ms (3,319, 3,440) | 3,277 ms | 1,609 | 19 | 15 / 365 | 230.9 MB | 56.3 s |
| Blazor WebAssembly | 29,163 ms (26,773, 34,137) | 3,614 ms | 1,600 | 25 | 5 / 31 | 81.6 MB | 117.0 s |
| Blazor Server | 4,250 ms (4,145, 4,772) | 2,954 ms | 1,433 | 25 | 1 / 1 | 3.2 MB | 50.4 s |
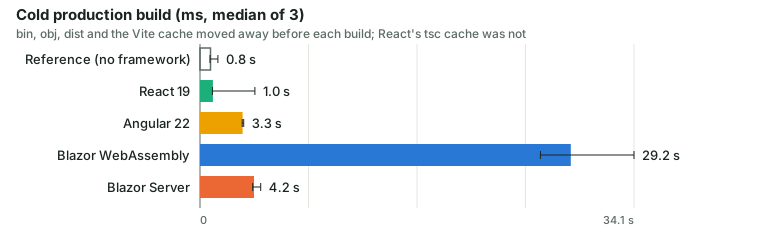
Three honest notes on this table. React's first cold build took 4.3 s and the next two about 1 s, because the TypeScript build cache lives in node_modules and the harness did not move it, so 1,017 ms flatters React a little. Blazor Server's dev start is the first prerendered page, which includes the server's own API call; the others are a static index.html. The two Blazor rows were first measured while another process on the PC was running a .NET build and test, so both were rerun on a quiet machine: WebAssembly's builds came out slower, 33,742 ms (33,188, 33,957), Blazor Server's 5,301 ms (4,234, 6,467), and the suite 158 s and 49 s. The first runs stand because they used the same protocol as the other three clients; the reruns say the overlap did not flatter Blazor. The 29-second WebAssembly publish is the IL linker trimming the runtime and the SDK compressing 94 files; the AOT publish added about two minutes on top.
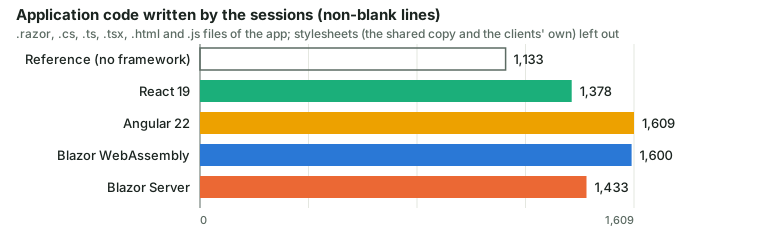
Lines of code are closer than the folklore says: React's 1,378 lines sit mostly in one file, Angular's 1,609 in 19, the two Blazor apps' 1,600 and 1,433 in 25 each. Blazor Server has one dependency, the framework; Angular has 15 direct and 365 in all, and a 231 MB node_modules.
F. Accessibility
| Client | Violations |
|---|---|
| Reference and React | color-contrast (serious, 1 node) in every state except the shortcut dialog |
| Angular | color-contrast (serious, 1), landmark-one-main (moderate, 1), region (moderate, 3) in every state except the shortcut dialog |
| Blazor WebAssembly | color-contrast (serious, 1), label-content-name-mismatch (serious, 2) in all four states |
| Blazor Server | color-contrast (serious, 1) in all four states |
The one contrast violation is the shared stylesheet's, so every client has it and the reference does too. Angular's sessions never gave the page a main landmark; Blazor WebAssembly's gave two controls an accessible name that does not contain their visible text. None of the four was asked for more than the spec's baseline, and none did more.
G. How well the AI built each
| Client | Sessions | First-time passes | Retries with a code change | Verdict flakes | Hand fixes | Turns | Meter | Wall | Denied commands | Dependencies added |
|---|---|---|---|---|---|---|---|---|---|---|
| Blazor WebAssembly | 16 | 14 of 15 | 0 | 1 | 0 | 333 | $9.03 | 63 min | 34 | 0 |
| Blazor Server | 15 | 15 of 15 | 0 | 0 | 0 | 378 | $10.38 | 53 min | 35 | 0 |
| React 19 | 17 | 13 of 15 | 0 | 2 | 0 | 319 | $8.86 | 38 min | 27 | 1 |
| Angular 22 | 16 | 14 of 15 | 1 | 0 | 0 | 390 | $10.08 | 68 min | 44 | 0 |
No client needed a hand fix, and the differences are small. React was the cheapest and the quickest; Angular took the most turns and the most denied shell commands (a cost of the harness, not of Angular: every denial is Claude Code refusing a chained or out-of-folder command). Blazor Server passed every step first time, but its step 1 alone cost 85 turns and $2.35 while the model learned that a prerendered page is visible before its circuit is alive. The failures that cost a verdict were timing, not framework errors: a test reading a row in the instant it disappeared (React, fixed by an optimistic update in step 7), Angular's zoneless redraw arriving one frame late (fixed by a change-detector call in the step 9 retry), and three retries that found nothing to fix. The Blazor, React and Angular posts walk every session.
H. What forty-five minutes in a browser found
The suite passes on all four. A person using each build for ten minutes found what a suite cannot. In Angular, the detail panel is never on screen: the router-outlet element takes a column of the shared grid, the main column shifts right, and the panel lands below the viewport on a page that does not scroll. Every panel test passed because the element exists and has a size. In Blazor WebAssembly, pressing Enter in the subtask box adds nothing and drops focus, and the tag box needs you to leave it and come back; the session that built step 10 had seen the same symptom and called it a one-in-fifty flake. In Blazor Server, clicking another list within a second of clearing the search loses the click, because the server's delayed URL update for the search wins. React showed nothing in the pass. The full log, with what was not tried by hand, is in the evidence.
The seven hypotheses, settled
- Blazor WebAssembly's first-load transfer is at least five times React's. True, by a wide margin: 2,461,774 bytes against 87,780, twenty-eight times.
- Unthrottled, input-to-paint on the 10,000-row list is within a factor of two across WebAssembly, React and Angular. False. A keystroke is 83.4 ms in WebAssembly against 17.1 in React, a toggle 36.2 against 16.7, selecting the list 1,302.7 against 126.5. With AOT it becomes true for everything but selecting the list.
- Blazor Server's latency is the round trip plus a constant, slowest at 100 ms on every interaction, fastest first paint. Half true. It is the slowest on every interaction at 100 ms except selecting the list, where it is the fastest because the browser never downloads the rows; and its first paint is not the fastest: 485.93 ms desktop LCP against React's 408.79, 1,654 ms mobile FCP against 752.
- The AI needs the fewest retries and hand fixes for React and the most for Blazor Server. False. Nobody needed a hand fix; Blazor Server had zero retries and React two flaky verdicts. Blazor Server's trap showed up as turns inside one step, not as retries.
- Angular produces the most files and lines; Blazor WebAssembly the fewest lines. Mostly false. Angular has the most lines by nine, 1,609 against WebAssembly's 1,600, but not the most files (19 against 25), and WebAssembly is nowhere near the fewest lines: React is, with 1,378.
- Lighthouse mobile: React and Angular 90 or more, WebAssembly below 70, Blazor Server above 90. True: 99, 100, 34 and 99.
- The AI's most common mistake is wrong or missing test-id names. False. Not one verdict failed on a test id. The mistakes were timing: an optimistic update missing, a zoneless redraw a frame late, a circuit round trip the model did not expect.
What to pick
An existing .NET team shipping an intranet app: Blazor Server. The bytes are small, the first paint is React-fast, the round-trip cost is invisible on a LAN, memory is about 11 MB per open tab on the server, and the AI built it without a single retry once it had learned the prerender rule. Teach it that rule on day one.
A public site where phones and slow links matter: React or Angular. They are within a few percent of a no-framework page on every startup and interaction number here, and Lighthouse mobile agrees. Between the two, this comparison found no performance reason to choose; Angular gave the AI more structure and more turns, React gave it fewer turns and one big file. Decide on team and tooling, not on these tables.
A .NET team that wants C# in the browser: Blazor WebAssembly, with AOT if interactions matter more than the first load, and only where a 2.5 to 4.7 MB download and a 3 to 5 second start on a slow link are acceptable: a line-of-business app people open once a day, not a landing page. Budget the 29-second publish.
A student: build the reference client first. It is 1,133 lines, passes the same 61 tests, and every framework number above is a distance from it.
What these numbers do not decide
One app, one PC, one model, one week, one run of five. The 10,000-row list is one virtualisation per client, chosen by the AI; a different choice moves the interaction rows. The Blazor Server 100 ms rows are a floor, not a measurement of a real link. Lighthouse mobile simulates a phone; no phone was used. Developer metrics measure a machine, not a team. And four AI-built apps say something about Claude Code with each framework in November 2026; they say less about what an expert would write by hand.
The meter: 64 metered sessions, about $38 at list price for the four
builds, plus the dry run and the retry sessions that changed nothing. Claude Code's
own total_cost_usd; on a Max plan a measure, not a bill. The harness,
the measurement pass and these posts were desktop sessions, unmetered and not counted.
Disclosure: this site runs on Blazor, static server-side rendering, and the author writes .NET for a living. The harness, the frozen suite and the pre-registered hypotheses exist so that this paragraph does not matter. Three of the seven hypotheses were wrong, and not all in Blazor's favour.
Checkpoint: every table above is in the repository's results page with the name of the raw file it came from, and the four clients are there with their per-step commits.
Do it yourself
Rerun one metric on your own machine and compare your median with the table.
- Clone the repository and start the API for the reference client:
git clone https://github.com/rahulvyas777/coder000-todo-four-ways.git cd coder000-todo-four-ways dotnet run --project api -- --urls http://localhost:16050 --db run/reference.db - Build the reference client (
npm installthennpm run buildinreference), precompress itsdistfolder withharness/measure/precompress.js, and serve it withhosting/StaticHoston port 16052. - Install the measurement scripts once (
npm installinharness/measure) and runpayload.js,lighthouse.jsandinteract.jsagainsthttp://localhost:16052with five runs; each script's header says its arguments. - Repeat for any client in
clients/with its build command fromharness/clients.json; Blazor Server runs from its publish folder instead of the static host. - Run the suite against the same host to confirm the build you measured passes all 61 tests.
- Compare medians, not single runs, and note your Chrome version and whether anything else was running.
What you should see: the same order in every table, with your own machine's absolute numbers.
Frequently asked
- Is Blazor slower than React?
- Blazor WebAssembly is: 2.46 MB on the wire against React's 88 KB, 3.0 seconds to the first row on a 100 ms link against 0.55, and 83 ms per search keystroke on a 10,000-row list against 17 without AOT. Blazor Server loads as fast as React and then pays a server round trip per interaction, 161 ms for a checkbox at 100 ms. React and Angular are within a few percent of a no-framework page on every number here.
- Does AOT compilation make Blazor WebAssembly fast?
- It fixes the interactions: 32 ms per keystroke, 17 ms per toggle, close to React. It makes startup worse: 4.7 MB on the wire, 5.1 seconds to the first row on a 100 ms link, Lighthouse mobile 32. Use it when people keep the app open, not when they arrive from a search result.
- Which framework did the AI build best?
- All four passed the same 61 tests with no hand fix. React took the fewest turns and dollars, Blazor Server passed every step first time, Angular needed one real retry for a zoneless redraw bug, and Blazor WebAssembly lost one verdict to a flaky test. The use pass found a layout bug in Angular, an Enter-key bug in Blazor WebAssembly and a lost click in Blazor Server, and nothing in React.
This is the last part. The method is in Part 1, the builds in Parts 2 to 4, and the repository holds everything else.